GA4 Advanced Segments, Audiences, and Comparisons are three ways to group your visitors, sessions, and events in Google Analytics data and find deeper insights. These three features are somewhat similar in their functionality while are also different. In this post, I am going to clarify what these three features are, how they are similar or different from others, and when you use them.
Comparisons in GA4
The comparison feature in Google Analytics (GA4) allows you to compare one subset of your data with other subsets. This feature is available on top of most of the standard reports. Those who are familiar with the Segments or Advanced Segments feature of Google Analytics will find this feature similar. However, this feature is very limited in nature and can't be considered "Advanced Segment". You can read about this feature in detail at Comparisons in Google Analytics 4 (GA4).
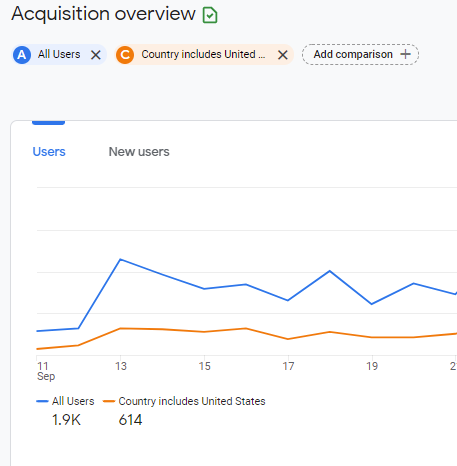
Use Comparisons, when you want to quickly compare your data from past data.
Segments in GA4
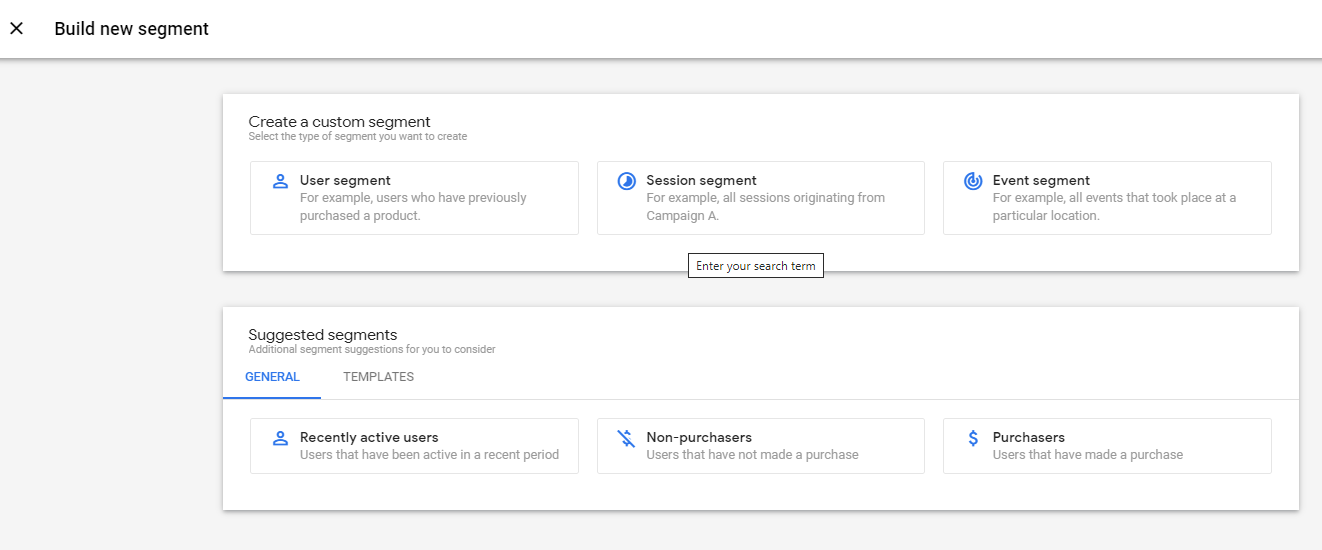
A segment is a subset of your data. In GA4 segment allows you to narrow down and focus on a group of users or sessions based on common attributes and conditions.
This feature is only available in Exploration, Segments can not be used in standard reports while Comparison is available for comparing charts and various metrics in Standard Reports. Comparison on the other hand can't be used in Exploration.
Just like Comparison, segments look at the users in past sessions so are retroactive. Read GA4 Segments Explained for more details on Segments.
Use segments when you want to drill deeper into your data explore it in detail.
Audiences in GA4
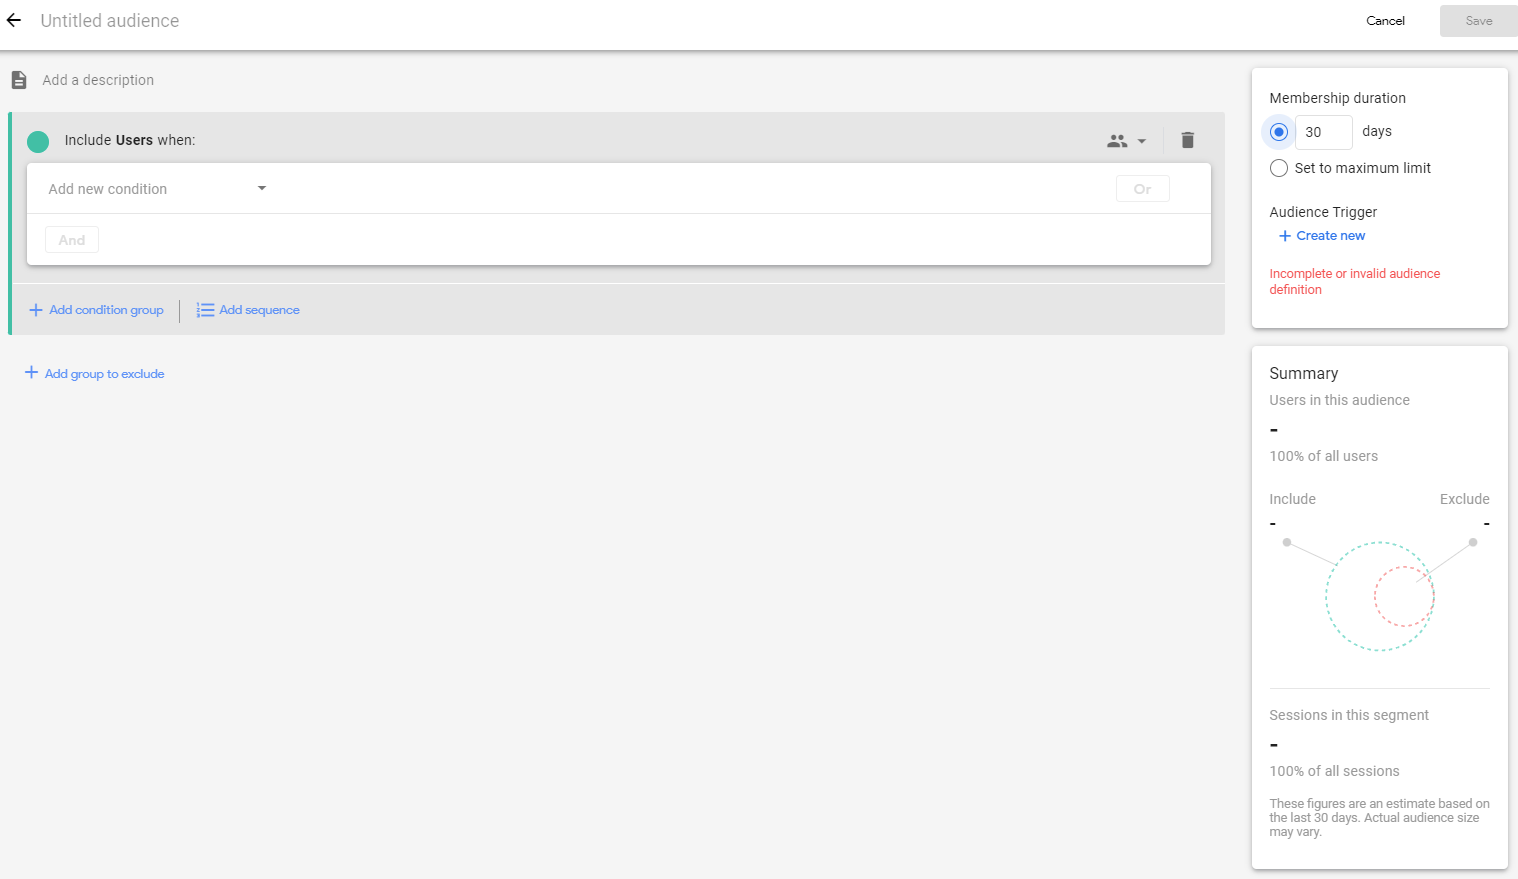
GA4 Audiences are groups of users based on common attributes, behaviors, etc. You can create an Audience using dimensions, metrics, and events to include any subset of users that makes sense for your business. In this post, you will learn about the GA4 audience so that you can start to create and use them with confidence.
Segments can not be used in standard reports while Audience can be used in standard reports by including them in Comparison as comparison criteria.
The audience is not retroactive, which means the Audience starts to accumulate users from the moment you build it. Audiences can be used to build comparisons and also target and retarget users using Google Ads. Read GA4 Audiences; How to create, edit, archive, and use Custom Audience to learn more about Audiences.
Use Audiences when you are going to target your users on Google Ads and do some quick comparisons.
Other Google Analytics 4 posts that might like
- GA4 Cross Domain Tracking: How to Track Multiple Domains and Sub Domains
- GA4 Segments Explained
- GA4 Audiences: How to create, edit, archive, and use Custom Audience
- Comparisons in Google Analytics 4 (GA4)
- 35+ Things About Google Analytics 4 That Will Make You Look Like a Genius
- How to Upgrade Google Analytics to Google Analytics 4 (GA4)?
- Google Analytics 4 (GA4) - Get Answers to Common Questions
Where to get more help with Google Analytics 4?
- Get your team ready for GA4 with this online self-paced course - Google Analytics 4 Masterclass
- Workshop - We offer onsite customized workshops. Reach out to us for more details.
- Consulting - We can get you up and running with Google Analytics 4 as well as train your and your team to use it effectively. Reach out to us for more details.
- Freelancers - Join our network and get support to help your clients with Google Analytics 4 and more.


