Thursday, February 25, 2010

Measuring Success of URLs Posted on Twitter

This post is the second part of my post on “3 KPIs for Measuring Twitter”. In the first part, I wrote that one of the KPIs for measuring Twitter is the Percent Visit Rate (%VR). %VR measures what percent of your followers click on your link to visit your site.

KPI: % Visit Rate = (Visits/Followers)*100))

Measuring VR the wrong way
  1. Referring Sites/Domains Report
    Late last year I did a small survey to understand how people measure the success of the links they post on Twitter. I found out that most of the people rely on “Referring Sites/Domains” report in their web analytics tool to see the traffic they get from Twitter. This seems like a great approach but there are two problems with this:


    1. Twitter.com is not the only way to access Twitter. A lot of people use 3rd party tools like Tweetdeck to access Twitter. A click on a link from such a tool won’t show up in the “Referring Sites/Domains” reports in the web analytics tool, it will be listed as “Direct Traffic” or “No referrer”.
    2. You can’t see the how each individual link (tweet) performed. Without this information, how do you know what works and what does not? How do you know what words trigger your followers interest?
  2. Click count from URL shorteners
    Some Twitterers rely on their URL shortening service, e.g. bit.ly, clop.in, cli.gs etc. to measure the success of the links they post on Twitter. They look at the clicks they get on the links. By using the click count from URL Shortener you can overcome the two limitations that I mentioned above. However, the URL shorteners usually count clicks and not the actual visits/visitors. Which means that they, not only capture human clicks but also the clicks from spider/bots, thus inflating the actual numbers of visits/visitors. And trust me there are several bots/spiders crawling twitter feeds and links.
    Another problem with using URL shorteners reporting is that they only capture the clicks and the sources but they do not provide any post click data on the visitors. To fully understand the impact of your tweets on our site or business, only counting the clicks or visits/visitors is not enough. You have to go beyond that. You have to understand how visitors interact with your site and if they take the desired actions or not.

Measuring VR the right way

To get an accurate count of the visits resulting from a link posted on Twitter, use your web analytics tool campaign tracking capability. Treat every link posted on Twitter as a new campaign. Tag the links with the campaign variables so that you can track in your web analytics tool.
When you treat the links posted on Twitter as campaign, you will not only get the clicks but also the visitors/visit count as reported by your web analytics tool. % VR can then be calculated by dividing the visits by the twitter followers.
(Note: Ideally you would want to measure Visitors instead of Visits but depending on your tool and considering cookie deletion you might not get an accurate count of Visitors).

Tagging the URLs with campaign variables

Let’s say, I want to post a link to my last blog post on Twitter. Instead of simply posting a link http://webanalysis.blogspot.com/2010/02/three-kpis-for-measuring-twitter.html, I will append campaign variables so that I can track the performance in my web analytics tool.
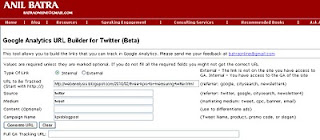
Since I use Google Analytics on my blog, I will use Google Analytics campaign tracking. In order to track my URL as a campaign, I will add three query parameters, utm_source, utm_medium, and utm_campaign to the URL.

I usually set the utm_source to “twitter” , utm_medium to tweet and utm_campiagn to a value that represents the content of my tweet.
The final URL that I will post on twitter will be
http://webanalysis.blogspot.com/2010/02/three-kpis-for-measuring-twitter.html?utm_source=twitter&utm_medium=tweet& utm_campaign=twitterkpi

Using a unique value for utm_campaign will allow me to not only know how much traffic is driven by twitter but also which tweets are driving the traffic. I can also create a custom segments in Google Analytics and analyze all my data for these segments.

The following site has 100 twitter followers so their %VR ranges from 1% - 6%. If you tie this information with the actual message in tweet, time of tweet, day of the tweet etc. you can figure out what works for the followers. By creating the segments you can slice any report in Google Analytics to see how visitors are interacting with the site.


To make it easier for you to add these variables, I have a simple Google Analytics campaign URL builderon my site that should help you to easily tag your links with the campaign variables for Google Analytics before you post them on Twitter. I might add support for other major web analytics tools in future.


Questions? Comments?


Looking to fill your Web Analytics or Online Marketing position?
Post your open jobs on Web Analytics Job Board

Senior Manager, Business Intelligence & Web Analytics at Freshdirect (Long Island City, NY)
Internet & Intranet Systems Programmer/Analyst at American Dental Association (Chicago, IL)

Measuring Facebook Fan Pages & Apps

The popularity of Facebook is growing. With 400 million users spending an average of almost an hour per day on the site, marketers are clamoring to invest in advertisements, Facebook Fan pages, custom applications, contests and more.

However, the analytics capability of for Facebook is pretty limited. So marketers spending all this money on facebook have very little insight into how their fan pages are performing.
Earlier this week I saw a tweet (message on twitter) with a link to Google Analytics hack for measuring facebook fan pages. We tried this hack but it had too many bugs and after wasting 2 hours we gave up on that solution.

As we were struggling with the GA hack, I got an email from Webtrends announcing their Facebook Measurement Capability. So I guess that is going to be our solution for measuring Facebook fan pages and custom apps but I will have to wait and see if it will live up to the expectations.

Here are some screenshots of Webtrends Facebook measurement reports


Here is a press release from WebTrends

“The ability to have concrete measurement on investments within Facebook and compare them apples to apples with other digital channels is critical to marketers,” said Jascha Kaykas-Wolff, vice president of marketing, Webtrends. “Our comprehensive approach to measuring Facebook, beyond just applications, allows marketers to understand the broader picture of how their Facebook investment is performing.”

Webtrends can now show you how your tabs, apps, and share features are working.
A few examples are:
  • Twitter activity driving to Facebook Fan pages
  • Facebook Fan page activity overlaid with corporate blog posts
  • Conversion performance if they happen in Facebook
  • Custom applications, Facebook page tabs, and Facebook ad click performance
Webtrends believes Facebook is one of the key social channels for brands to invest in and these capabilities will help them validate those investments.

Webtrends Analytics for Facebook
Webtrends’ new Facebook measurement capabilities utilize Webtrends Analytics 9, which combines our powerful real-time analytics engine with its best-in-class user interface. For the first time, marketers can view their Facebook measurement alongside other digital marketing investments such as websites, microsites, blogs, mobile apps, and more. Additionally, using Analytics 9’s RSS overlay capabilities, marketers can easily see the impact of promotional efforts. Tracking custom tabs, applications, and sharing provides the most complete measurement of Facebook available in the market.

How Webtrends Analytics Collects Data on Custom Tabs
Custom tabs and applications have critical differences for data collection, due to Facebook’s Terms of Service and its commitment to user privacy.
  • Brands can’t use traditional analytics methods for tracking custom tabs because Facebook does not allow Javascript, and they aggressively cache images.
  • To overcome these limitations, Webtrends developed a new method that uses their data collection API to bring Facebook data into Webtrends Analytics.
  • In addition to tracking tab views, Webtrends can also measure:
    • Tab views segmented by fans and non-fans
    • Clicks on buttons and links, such as the Share button and its options

How Webtrends Analytics Collects Data on Facebook Applications
  • Applications allow more tracking options both because they allow Javascript and because the Facebook’s Terms of Service allows for collection of user level data.
  • Webtrends utilizes their Data Collection API to bring Facebook data into Webtrends Analytics.
  • Webtrends can measure any type of application built on the Facebook platform.

The Great Data Giveaway – A Demonstration of Webtrends’ Facebook Measurement Capabilities
To demonstrate their new capabilities, Webtrends created a prototype Facebook campaign called The Great Data Giveaway. Webtrends is using this campaign as a model for their customers’ reference.

“Marketers are wrestling with how to earn and prove ROI from social media marketing,” said Kaykas-Wolff. “We designed The Great Data Giveaway to not only demonstrate our new capabilities in action, but to also show marketers that social channels like Facebook can generate qualified leads.”

The campaign is a drawing for prizes that appeal to Webtrends’ target market, which are data prizes like ReadWriteWeb premium reports and InfoChimps’ Twitter Census Data.
  1. Webtrends created an application and placed it on a custom tab on Facebook to explain the contest details. KPIs: views segmented by fans and non-fans.
  2. The user becomes a fan first (known as a “fan-gate”), then allows the installation of the app in compliance with Facebook’s Terms of Service. KPIs: Rate of fan interest, number of installs.
  3. Once the app is installed, the user can enter the contest via a form driven by our Eloqua marketing automation system. KPIs: Entries, follow-up email opens, follow-up email conversions.
  4. The app allows users to post the contest info to their wall. KPIs: Number of shares.
  5. Webtrends marketing provides air-cover for the contest by mentioning it on Twitter and in blogs. KPIs: RSS overlay of promotion efforts on views (tab) and visits (application).

“We are so proactive in talking about Facebook measurement because it’s a critical area of growth for our customers. The new capabilities we have developed were shown at our recent user conference, Engage 2010, earlier this month, and we have several implementations underway,” said Kaykas-Wolff. “To meet their needs and keep up with the rate of change in this space, we have a series of capabilities we’re adding to Webtrends Analytics that will be released in the near term and ongoing basis.”

Webtrends Analytics 9 for Facebook Webinar
Webtrends will also host a Webinar in April discussing how companies can take advantage of Facebook measurement in Webtrends Analytics 9. For more information including registration, date and time, please visit us here.

If you are interested in seeing more about how you can measure Facebook in Webtrends Analytics, please visit our solutions page here

Monday, February 22, 2010

Three KPIs for Measuring Twitter

How do you measure if you are being effective on Twitter or not? In my opinion it really comes down to measuring if anybody is paying attention to what you are saying or not, everything else follows. If you can measure the true impact on the bottom line then you are way ahead of a lot of people on Twitter. Congratulations to you!!! However, not everybody is yet in a position to measure at that level. This post is about metrics that you can measure on daily basis even when you don’t know the final impact on the bottom line.

Key actions as a result of your Tweets

As I said above, your success on Twitter comes down to one thing: Is Anybody paying attention to what you are saying on twitter? If people are paying attention to what you are saying then one or more of the following will immediately happen:
  1. Retweets
  2. @[twitter username] replies
  3. Visits from the links posted in your tweets
Let’s look at each of these measures
  1. Retweets
    When some Retweets your message, their followers see your message. Retweets indicates and endorsement of your message. Retweeters likes what you have to say and wants his/her followers to see that message as well. Pretty Neat!!!. There are two ways you can see the number of Retweets on Twitter:
    1. Under Retweet link on Twitter
    2. Searching for RT @[ twitter user name] or Retweet @[ twitter user name]in the twitter search box – Many people still use old fashioned Retweet which is to add RT or ReTweet in front of the username. (@[twitter username is also available via a link on Twitter.com, see below)

    Also, check out ReTweet Demystified

    KPI: Number of Retweets (Ideally I would like it to be % Retweet = (Retweets/Number of Followers)*100 or RPM = ReTweets Per Thousand Followers, but I have found both these numbers to be really low most of the time.)


  2. @[twitter username] replies
    @ reply is used by the twitter users to send a reply to you. Just like a Retweet, when someone sends a message with @[username] their followers see that message (assuming their followers are paying attention). The @reply also indicates that the other person is engaging in a conversation with you.
    It is not only important to look at @[username] replies but also to look at the sentiments of those replies. Positive sentiment is mostly good and negative sentiment could be good too, it depends on how you will use that information and act on it.
    (Note: There is another version of reply called Direct Message. This message is directly to you and is not visible to others.)

    KPI: Number of @[twitter username] replies (Ideally it should be ARPM = At Replies per 1000 visitors or % AR but this number is low too just like ReTweets)


  3. Visits from the links posted in your tweets
    Even if you are not trying to drive sales/leads from Twitter, every now and then post a link to your site in your tweets and see how many visits (or visitors) you are getting as a result of those links. Over a period of time you will know how many people are really paying attention to your tweets (or you are grabbing attention of). In my next post I will go into the details of measuring the traffic driven by twitter.

    KPI: % Visit Rate = (Visits/Followers)*100))
Additional Metrics
  • Lists
    Twitter Lists are a way for Twitter users to organize people they are following into groups. Similar to users, you can also follow the lists. Getting included in a list could potentially provide you more reach.
  • Number of Followers
    Number of followers is a good measure of reach. Growing number of followers indicates that your potential reach is growing. However, if all the people who follow you don’t engage in any of the activities listed above i.e. ReTweet, @ reply or click on a link then number of followers doesn’t mean much.
What about Followee to Follower Ratio?

I am not a believer in this ratio. Usually, if you are a celebrity (or at least think that you are and you think that no one else is worth following) then you will have a high followee to follower ratio. By followee to follower ratio, Guy Kawasaki won’t be considered a success on twitter because he follows more people than the number of people who follow him, giving him a ratio of less than 1 but given the amounts of Retweets he gets, he is certainly a success.

At the end your twitter success boils down to: Is anybody paying attention? Are you engaging the customers/prospects in a conversation? If people are paying attention and are engaging with your tweets then they will Retweet, reply or click on the links that you post in your tweets.

Three KPIs
  1. Number of Retweets
  2. Number of @[Twitter username] replies
  3. % Visit Rate = (Visits/Followers)*100))
So that’s it. No Retweets, No @replies and no click on your links indicates ZERO engagement.

What do you think?


Looking to fill your Web Analytics or Online Marketing position?
Post your open jobs on Web Analytics Job Board

Senior Manager, Business Intelligence & Web Analytics at Freshdirect (Long Island City, NY)
Internet & Intranet Systems Programmer/Analyst at American Dental Association (Chicago, IL)
Tuesday, February 02, 2010

Significance of Statistically Significant Results in A/B Testing

You are running an A/B test (or multivariate test) but are in a hurry to make a decision to pick the winning page. Should you pick a winner based on initial few days of the data before your tool has actually declared a clear winner? This question comes up quite often during the conversations with the clients.

I always warn against such an approach and advice to be patient and get statistically significant results before pulling a plug on an underperforming variation o declaring a winner. I wanted to share few graphs with you to illustrate my point.

The following example is from a test that I am currently running.
First Two Weeks: If you make a decision without completely getting through the test, you will pick “Yellow” as the winner while declaring “Blue” a loser.


Month Later: There does not seem to be a clear winner.


Few More Days Later: Seems like “Blue” is trending higher. Should you pick “Blue” now?


Finally: We don’t have a clear winner yet.


As you can see, picking a winner or dropping a loser in the early stages of test, without having a statistical significant result, would have been a wrong decision.

Comments? Questions?


Looking to fill your Web Analytics or Online Marketing position?

Post your open jobs on Web Analytics Job Board
--------------------------------------------------------------------------