Friday, October 22, 2021

GA4 Advanced Segments, Audiences, and Comparisons


GA4 Advanced Segments, Audiences, and Comparisons are three ways to group your visitors, sessions, and events in Google Analytics data and find deeper insights.  These three features are somewhat similar in their functionality while are also different. In this post, I am going to clarify what these three features are, how they are similar or different from others, and when you use them.

Comparisons in GA4

The comparison feature in Google Analytics (GA4) allows you to compare one subset of your data with other subsets. This feature is available on top of most of the standard reports. Those who are familiar with the Segments or Advanced Segments feature of Google Analytics will find this feature similar. However, this feature is very limited in nature and can't be considered "Advanced Segment".  You can read about this feature in detail at Comparisons in Google Analytics 4 (GA4).
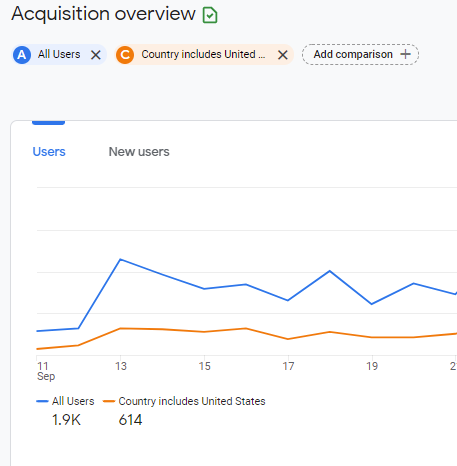
Use Comparisons, when you want to quickly compare your data from past data.

Segments in GA4

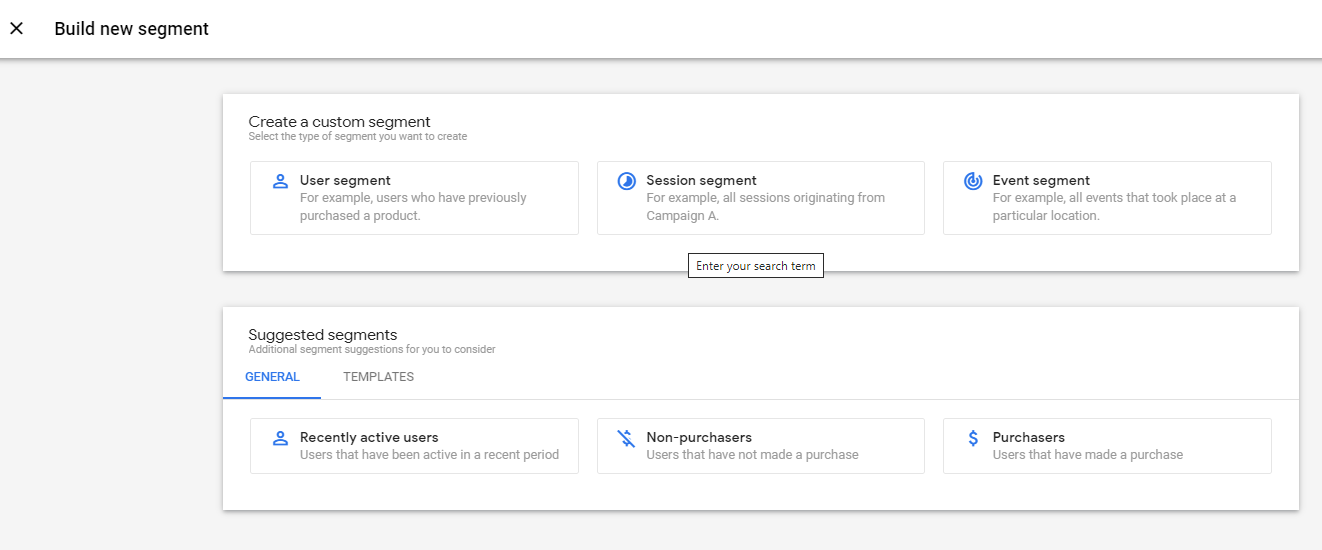
A segment is a subset of your data. In GA4 segment allows you to narrow down and focus on a group of users or sessions based on common attributes and conditions.

This feature is only available in Exploration, Segments can not be used in standard reports while Comparison is available for comparing charts and various metrics in Standard Reports. Comparison on the other hand can't be used in Exploration.

Just like Comparison, segments look at the users in past sessions so are retroactive.  Read GA4 Segments Explained for more details on Segments.

Use segments when you want to drill deeper into your data explore it in detail.
 

Audiences in GA4

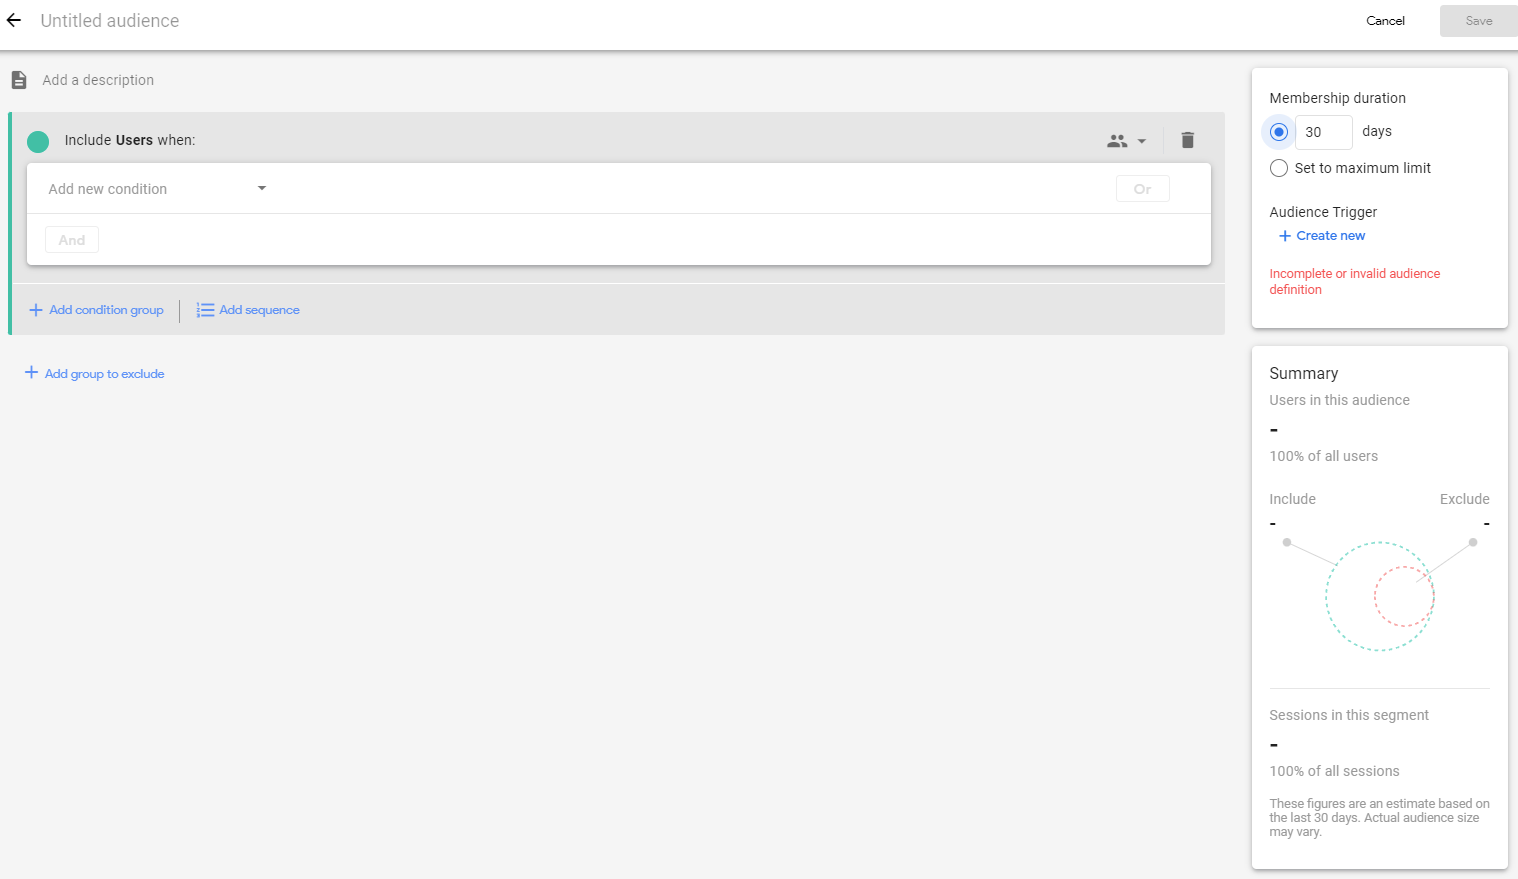
GA4 Audiences are groups of users based on common attributes, behaviors, etc. You can create an Audience using dimensions, metrics, and events to include any subset of users that makes sense for your business. In this post, you will learn about the GA4 audience so that you can start to create and use them with confidence.

Segments can not be used in standard reports while Audience can be used in standard reports by including them in Comparison as comparison criteria.

The audience is not retroactive, which means the Audience starts to accumulate users from the moment you build it. Audiences can be used to build comparisons and also target and retarget users using Google Ads. Read GA4 Audiences; How to create, edit, archive, and use Custom Audience to learn more about Audiences.

Use Audiences when you are going to target your users on Google Ads and do some quick comparisons.
 

GA4 Audience


Other Google Analytics 4 posts that might like

Where to get more help with Google Analytics 4?

Tuesday, October 05, 2021

5 Google Analytics 4 (GA4) posts that you must read

Google Analytics 4 also know as GA4 is in news for the past year. Here are some Google Analytics 4 blog posts that will help you demystify this new tool from Google.

18 Key Benefits of Google Analytics 4

If you are wondering what are the benefits of Google Analytics 4(widely know as GA4) then this post is for you. Read more...

How to Downgrade Google Analytics 4 to Universal Analytics?
When you create a new Google Analytics property it is automatically created in GA4, this post shows you how you can create it in the old version. Read more...

GA4 can send data to BiGQuery without any 3rd party tools. Learn how to enable that data transfer in this post. Read more...

35+ Things About Google Analytics 4 That Will Make You Look Like a Genius
The intent of this post is to highlight a few things about Google Analytics 4 without going into the details. Read more...

Should You Upgrade to Google Analytics 4 (GA4)
Well GA4 is all new, this post answers if you should upgrade or not. Read more...

Learn More about GA4

Optizent Academy memberships’ sole focus is to develop data-driven marketers and digital analysts. No matter which stage of your knowledge and career you are at, we have courses and training options for you. Visit https://academy.optizent.com/courses/membership to learn more about Optizent Academy.

Optizent Academy Membership provides

  • Access to courses, eBook, and presentations based on 20 years of Digital Analytics Consulting and Training Experience and 20+
  • Regular training sessions and challenges to test, enhance and add to your skillset
  • Exclusive access to a community to support you when you need it, so you never feel alone
  • Professional Relationships & Network Development
  • Practical advice - apply what you learn right away

GA4 Consulting Services

Contact Us to learn about our consulting services and how we can help your organization.

Get the Book version of this post at https://academy.optizent.com/f/30-things-to-know-about-google-analytics-4

Monday, November 30, 2020

10 Key Things to Know Before Upgrading to Google Analytics 4

Google Analytics 4 is here and is now the default version of Google Analytics when you create a new property.  For all the existing Universal Analytics, current or previous version depending on how you look at it, there is an option to upgrade to Google Analytics 4. I am sure you have several questions regarding this upgrade process. I am going to answer many of those in this and several other blog posts.

Send me your questions by leaving a comment below:

  1. The upgrade is not what it sounds - Upgrade usually means that you lose the previous version and just get the new functionality, right? Well, that is not the case with Google Analytics upgrade to Google Analytics 4. Upgrade in this case means that you will get a new Google Analytics property that will take some basic settings from your current Google Analytics property and use those to set up a new Google Analytics 4 property. So there is no need to worry about losing your existing property. After the upgrade process is complete, you will actually have two properties collecting data for your web site. This gives you an opportunity to play with the new version without losing your existing setup and functionality.
  2. New setup and possibly new tags will be required - If you are using gtag on your current site then you can use it to send the data to the new Google Analytics 4 property. If not then you will have to put new tags. The global site tag (gtag.js) is a JavaScript tagging framework and API that allows you to send event data to Google Analytics, Google Ads, and Google Marketing Platform.  If you are not using gtag then you will need to add new tags on your site. If you are using Google Tag Manager then you will have to set up new data collection tags. Many things such as events, audience, and conversions will require setup changes.
  3. No Views - In Universal Analytics you had the ability to create a view to see a subset of your data. For example, if you wanted to remove traffic to your site from within your organization then you would create a new view, apply a filter that removed internal traffic, and then used that view to understand site usage by "actual" users.  (learn more about the view on Optizent YouTube channel). In Google Analytics 4 you don’t have an option to create views instead of views you can use analysis Hub or segmentation feature to narrow down to the data that you want to track and analyze.
  4. New data model - Google Analytics 4 has a completely different data model than the previous version - Google Analytics 4 is based around Events and Users. Every session is an event, a page view is an event, every interaction within the browser is already tracked, and an event or can be tracked as an event.
  5. Event tracking has changed - In Universal analytics, event tracking required you to pass the parameters, Category, Action, and Label attributes. Event tracking has now changed, you now have parameters and values attached to each event and you can pass up to 25 name-value pairs are parameters.  This allows for deeper analysis (check out Google Analytics & Events setup video).
  6. Several Events are tracked without any setup - Google Analytics 4 automatically tracks scroll, outbound link clicks, downloads, engagement with YouTube embedded videos, and onsite-search. They are set up by default when you create a new Google Analytics 4 property. You can disable them if you would like in the admin panel of Google Analytics 4 property (check out Google Analytics & Events setup video).
  7. Goal and conversion tracking has changed - In the past there was a separate setup for Goal tracking where you define different types of goals and set them un in the "Admin" interface of Google Analytics view. Now it is all ever based. You define and track an event and convert an event into a conversion event right within Google Analytics property (check out Google Analytics & Events setup video).
  8. Not all reports are available in Google Analytics 4 - Google Analytics 4 has a limited number of predefined reports. Many of the reports that you have been used to in Universal Analytics are no longer there. Some of them are not available because Google Analytics 4 is still in development, others are not available because the Google Analytics data model has changed and those reports don't make sense anymore. Instead of pre-defined reports, Google Analytics 4 has "Analysis Hub" which is similar to Google Data Studio type reporting or Adobe Analytics Workspace. In this interface, you pick Dimensions, Metrics, and Segments to build the report that you want. This new interface and metrics/dimensions means that you will have a bit of a learning curve so be prepared for it.
  9. No Bounce Rate - Many of you have relied on bounce rate for years to see how successful your site or marketing campaign was. Well, the Bounce rate is no longer in Google Analytics 4. Instead of bounce rate, Google Analytics 4 provides Engaged Sessions. An engaged Session is defined as a visit that engages with the site or app for at least 10 seconds or has two-page view events or a conversion event.
  10. Numbers will not match - Since there is a difference in Google Analytics 4 and Universal Analytics measurement, data model, and processing of hits, some numbers won't match between the two systems. You will likely find a slight difference in Session count and Active User Count.


Need help with Google Analytics 4? Contact Optizent

Want to learn on your own? Signup for online Google Analytics 4 course on Optizent Academy.

Saturday, May 30, 2020

Real Time Reporting - What and Why

What is Real-time reporting?
Real-time reporting provides you a view into what is happening at that very moment. In the context of Web Analytics, real-time reporting gives you a glimpse into what't happening on your website at . 

It provides you view into on how many visitors are on your site. Which campaigns, sites, search engines, social media sites etc. they are coming from, which pages they are looking at, what actions they are taking on on etc. 

How Real-time reporting can help

Though most of your insights are going to come from the not so real-time data. Real-time reporting can help in several scenarios. Below are some use cases for real-time reports:

  • Campaign Launch - When you launch a new campaign e.g. paid search, email newsletter, TV ad etc. you want to see how people are reacting to those campaigns then real time makes sense but only for initial diagnosis. Wait for complete data to make any changes.
  • New Promotion - When you add new promotions on your site and want to see how visitors are reacting to those promotions, so that you can tweak/ experiment new version of those promotions in real time, then yes you should look at real time data.
  • New story/content - When you add new stories, links etc. and want to see if anybody is clicking on them so that you can make some changes based on instant feedback. I can see the usefulness of this feature for news and media sites.
  • Site Changes - When you launch a new version of the site and want to see if new pages are being recorded in Google Analytics and if you users are interacting as expected then real time reports can help.
  • Tracking Changes - When you roll out new tracking changes and want to see if those changes are working or not. For example, you just enabled Event Tracking via Google Tag Manager and want to see if the events are capturing the right data or not. In this case you will check the real time Events report in Google Analytics. I expect you to check the changes on a development and QA environment before rolling out.
  • New Features - When you launch a new feature on your site, launched a video, deployed a new game and would like to know if your visitors are using it or not, real time reports can help.

Keep in mind that even if you are ready to make changes in real time, you might not have statistically significant results based on few data points that you get in real time reports. 

What do you use the real time reports for?

-----------------------------------------------------------------------------------------------------------


------------------------------------------------------------------------------------------------------------

Friday, May 22, 2020

Who owns your website, user data and digital assets?


Should you build your audience and pages only on 3rd party platforms such as Facebook, Twitter, YouTube etc.? This is a questions that I see quite frequently in various digital marketing forums.
In this post I am going to provide you my point of view on this subject.

These 3rd party platforms are huge with lots of traffic so first and foremost you should try to grab your share of the traffic from them. You should work hard to clearly figure out how to make the most of these platforms and how to leverage their reach to help your business grow.  However, you should not build your entire business on them. 

Why you might ask?  Because they have the power to shut you down anytime for no fault of your own.You don't want to be in a situation where you entire business comes crashing down one day.  You are at their mercy, you don't control their terms and polices, either you agree or disagree. If you disagree then you can't be part of that platform or network.

If for some reason you are found in violation of any of their terms and policies you could be completely shut out. Then all you are left with is to fight with back and forth emails, if you are lucky. In most cases you might not even get a timely response.

Some Examples:

Facebook blocked user accounts - Check out this post titled "What I Learned When Facebook Disabled My Account". This post has a lot of comments about people losing their access to Facebook and hence access to their pages and groups etc.

Twitter suspending accounts  - Below is an example tweet that shows you that once your account gets suspended then it becomes difficult to get it restored


My Experience:

I also had such experience recently where Google shut down my account for a few minutes. I am still not sure why that happened. All I got was an email that my account was suspended for not following Google policies but they did not give any clear indication.  The email was very generic in nature and I believe that was done automatically by an algorithm. Since the email was sent to my gmail account, I only got that after the account was restored. I was lucky that it got restored automatically in few mins. 

However this experience was scary as I have a lot of stuff on Google.  I have my emails on Gmail, my pictures on Google, Videos on YouTube, this blog is on Blogger (owned by Google), Google docs etc. Imagine if I was left without access to these things for days. 

Solution

Always keep a backup of important files, documents, emails and audience that your business depends on.

Businesses

  1. Drive your  audience to your own websites and blogs (not a free platform as I do). Facebook pages, groups, twitter accounts are all great but you really don't own them so make sure to drives users to your own sites.
  2. Build your own marketing lists - collect emails.
  3. Own the customer information and data rather than just relying on a pixel that sends the data to Google and Facebook. 

Individuals
  1. Have a back email solution - keep important contacts and emails in multiple places
  2.  Keep backup of your docs, photos, videos etc. in multiple places - I keep them in Google, Amazon, OneDrive etc.
  3. If you want to keep them in one place then have multiple account access so even if you lose one account, you have other admin accounts that can access them.

Do you really own anything?

You rent domains names, host sites and data in cloud owned by other companies. They can decided to shut it down for violation of terms. Your emails service provider sends emails on your behalf, they can take away your ability to email to your customers if you have too many spam complaints or other service violations. Your business or personal digital assets are stored with someone else, there is a possibility of you losing access. Isn't it? 

Anything else you would like to add? Share you experience in the comments below.

-------------------------------------------------------------------------------------------------------
Check out our online courses at Optizent Academy


Monday, April 06, 2020

Enroll in Digital Analytics Association's Essentials Series – Fundamentals in Digital Analytics

I am excited to announce that I will be conducting Digital Analytics Association's Essentials Series – Fundamentals in Digital Analytics. This is a LIVE, interactive, discussion-based education program that will be offered completely online, and only once per year. You’ll have access to me and fellow classmates through DAA's learning platform.
When you sign up for the first Essentials Series Online course, Fundamentals of Digital Analytics, you will learn key competencies, and gain knowledge and skills in the areas of: data capture and measurement, reporting and forecasting, analytical business culture, site optimization and marketing campaigns.
So, what can you expect from your LIVE learning experience:
Course 1 - Fundamentals of Digital Analytics is a series of 6 LIVE classes that are prescheduled, and will begin on Tuesday, April 14th. The courses will be held on Tuesdays and Thursdays from 12:00pm EDT – 1:00pm EDT with me conducting an “online class” format, allowing students access to a SME for Q & A and/or class discussion.
This will consist of: Coursework/assignments that will be completed weekly prior to the online class . Zoom technology will be used, and sessions will be recorded for accessing on-demand. Never use Zoom technology for your learning before? Check out the software and technology requirements to support this learning format. It will require a PC, Tablet, iPad, etc. that has audio and video capability. This will allow for the full, LIVE, virtual learning classroom experience.
What you will learn in the Fundamentals of Digital Analytics course: Whether you are new to web analytics, new to web management, or just need to be sure that you are seeing the forest for the trees, this is the best place to get grounded in the basics. In this introductory workshop you will learn about:
  • Metrics terminology and technology
  • Most critical web metrics
  • Performance Indicators
  • How to derive business value from web analytics
  • The skills you need (or need to look for in others) to build a web analytics powerhouse
  • A process for creating a web analytics culture and making it stick in your organization
  • How to gain executive buy-in
  • Insight into optimizing your business with web analytics
  • Getting started with visitor data analysis
Class dates/times will be:
  • Tuesday, April 14th, 12:00 pm ET – 1:00 pm ET
  • Thursday, April 16th, 12:00 pm ET – 1:00 pm ET
  • Tuesday, April 21st, 12:00 pm ET – 1:00 pm ET
  • Thursday, April 23rd, 12:00 pm ET – 1:00 pm ET
  • Tuesday, April 28th, 12:00 pm ET – 1:00 pm ET
  • Thursday, April 30th, 12:00 pm ET – 1:00 pm ET
  • Tuesday, May 5th, 12:00 pm ET – 1:00 pm ET (Make-up class if needed)


Upon completion of the course, candidates/participants will receive:

  1. Certificate of Completion in the Fundamentals of Digital Analytics.
  2. Digital Badge to promote to others your successful completion of this course.
  3. Evaluation of the course, so we can continue to improve for future learners.


Pricing for Essentials Series Course I: Fundamentals of Digital Analytics:

Member: $850
Non-Member: $1050

How do I get started?

Take your career to the next level by earning a Certificate in the Fundamentals of Digital Analytics
Watch the recorded, pre-launch webinar CLICK HERE

Thursday, December 12, 2019

Google Tag Manager Book

I am pleased to announce that my first ever book is now available on Amazon.


Google Tag Manager - Zero to Hero

This book teaches you everything you need to get started with Google Tag Manager. The book is based on my best selling Google Tag Manager Course.

Reviews:

If you know nothing about Google Tag Manager, this is THE very best place to start. If you've been working with Google Tag Manager for some time, this book will validate what you know and unpack the complexities you've tripped over. There is no fluff in this book. It jumps straight into the details in the proper order and at the right speed for understanding and mastery. There are no wasted words - no wasted time.

I've known Anil Batra for almost 20 years through our relationship in helping create the Digital Analytics Association (DAA) and his speaking at my Marketing Analytics Summit. He has given lectures, produced workshops, and delivered online courses for the DAA (and other organizations), teaching thousands of students. All of them have given Anil the highest scores for his lucidity and the depth of his knowledge. Anil is that rare combination of knowledgeable, forthcoming, and accessible. Clearly, I am a fan.
 - Jim Sterne, Founder Marketing Analytics Summit & Co-Founder Digital Analytics Association

I have been a member of Anil's Udemy classes and Facebook group for quite some time. I bought the book because it is a great resource to refer to. Plus, it makes me smarter! He is an excellent instructor, you will love his presentation style.
 - Brenda M.

In this book I take you through various features of Google Tag Manager and show you how you can implement various Tags.You will go from not knowing anything about Google Tag Manager and Data Layers to mastering them and using them with confidence.

The book will cover the following topics
  • Fundamentals and Essentials of Tag Manger (Applies to any tag manager) 
  • Signing up for Google Tag Manager 
  •  Details of Google Tag Manager Interface 
  • How to setup Google Tag Manager for Google Analytics and track page views 
  • How to setup external link tracking as Events in Google Analytics via Google Tag Manager
  • How to setup Button click tracking in Google Analytics 
  • How to track JavaScript errors using Google Tag Manager ( GTM) 
  • Deploy GTM in WordPress Understand and use Data Layer in Google Tag Manager 
  • Pushing dynamic values and custom event in DataLayer


You can order your book at Amazon or on https://training.optizent.com.  Get a video course of the same book at https://training.optizent.com


Not interested in Book? Signup up free Google Tag Manager course.

-----------------------------------------------------------------------------------------------------------------

Get Access to 21+ courses - Here is a limited time coupons for Free Trial - Use Coupon Code FREETRIALhttps://training.optizent.com/p/full-access-to-all-courses/?product_id=1025897&coupon_code=FREETRIAL


Monday, October 21, 2019

Artificial Intelligence (AI) for Marketing 101

These days there is a lot of buzz in the marketing community about use of Artificial Intelligence (AI) and Machine Learning (ML) in marketing.

In this post I will cover some basics of AI that you need to know before you can explore how AI and ML can help you in your marketing efforts.

What is Artificial Intelligence? 

There are several definitions of Artificial Intelligence or AI. The simplest one to understand is from Oracle.com: "Artificial intelligence (AI) refers to systems or machines that mimic human intelligence to perform tasks and can iteratively improve themselves based on the information they collect."

So in a nutshell AI refers to machine, which can learn and become intelligent like humans.

AI is an umbrella term that includes algorithms, concepts, tools, technologies etc. that perform these complex human like tasks.

One of such and widely used concept in AI is Machine Learning.  Keep in mind that all machine learning is AI but not all AI is Machine Learning as AI include much more than just Machine Learning (ML).

What is Machine Learning (ML)?

Machine learning is the practice of using statistics to parse large amount of data (structured and unstructured), find patterns in it, learn from it, and then make a determination or prediction about something in the world. So rather than hand-coding software routines with a specific set of instructions to accomplish a particular task, the machine is “trained” using large amounts of data and algorithms that give it the ability to learn how to perform the task. (definition modified and adopted from: Nvidia).

Machine learning builds a mathematical model based on sample data, known as "training data", in order to make predictions or decisions without being explicitly programmed to perform the task. (source: https://en.wikipedia.org/wiki/Machine_learning)

There are three major types of learning used to train these models - Supervised learning, Unsupervised Learning and Reinforcement Learning.

Supervised Learning

In supervised learning, the algorithm builds a mathematical model from a set of data that contains both the inputs and the desired outputs.
(source: https://en.wikipedia.org/wiki/Machine_learning)

Example: Predict churn propensity of a customer.
You can provide training data that contains customers purchase data, past behavior data (input) and then each customer is labeled if they churned or not. Based on this data, model learns what purchase and behavior data will cause all the customers to be labeled as "Churn Risk" or "Not Churn Risk".


Unsupervised Learning

In unsupervised learning, the algorithm builds a mathematical model from a set of data which contains only inputs and no desired output labels. Unsupervised learning algorithms are used to find structure in the data, like grouping or clustering of data points. Unsupervised learning can discover patterns in the data, and can group the inputs into categories. (source: https://en.wikipedia.org/wiki/Machine_learning)

Example: Uncover customer segments.
Unsupervised learning can help find various customer segments in your customer data using customer attributes, sales, onsite behavior etc.. This can then be used to drive better customer engagement and better marketing performance.

Reinforcement Learning

In Reinforcement learning, the agent (also called Machine, model or AI) is given a problem to solve and faces a game-like situation. It is given rewards for positive behavior and punished for negative behavior as it tries to solve the problem.. These rewards are provided by the developer of AI. The machine uses trial and error to come up with a solution to the problem. The developer does not provide the model any hints or suggestions for how to solve the game. It’s up to the model to figure out how to solve the problem and maximize the reward. The end goal is to make the model learn desired behavior that maximizes the total reward.

Example: Provide recommended products to customers.
Reinforcement leaning can be used to develop a online product recommendation engine.

Other Terms that you should be aware of

Structured Data

Data that can be organized in rows and columns such as Customer Demographics, Sales data, onsite behavior data etc.

Unstructured Data


Free form data such as word documents, call scripts, pdf, images etc. Anything that is not structured is classified as Unstructured data.

Marketing Uses of AI

There are several ways AI can be used in Marketing.  Here are some examples, this is not a complete list. I will add more articles in future to cover several use cases.
  • Customer Segmentation
  • Ad budget allocation across channels or by channel
  • Content creation
  • Chatbots - Which understands humans questions and then responds with appropriate response.
  • Churn Prediction/Customer Retention
  • Product recommendation engine
Hopefully this article provides some clarity to the confusion around AI in Marketing.

Your turn now. Are you using AI for marketing? If yes, how? If not then why not? What are the challenges. Let's talk.


----------------------------------------------------------------------------------------------------------

Signup for my online courses. Here is a coupons for 50% off on the first month. Use coupon code 50OFFFIRSTMONTH at checkout.


Thursday, October 10, 2019

Essential Excel Features & Functions for Marketing Analytics

Excel is one of the most used tool for data analysis by marketers, marketing analysts, web and digital analysts.
We (Optizent.com) have developed a course that will teach you Excel Functions and Features that you need for Marketing Analytics. You will also get several practical examples of how to use them for your analysis. Not only do we teach excel functions and features useful for Marketing, Digital and Web Analytics but also you will get cool ideas about what data you can analyze.

What you’ll learn
  • Understand various types of errors Excel throws and how to fix them
  • How to suppress the error or replace them with more meaningful data
  • Learn different ways of combining data from multiple columns
  • Understand different types of cell references.
  • Bulk delete blank rows to clean your excel sheet data
  • Find duplicate rows of data, highlight them and/or bulk delete them
  • Learn how to use VLOOKUP - Uses search engine (SEO) keyword data as an example.
  • Learn Pivot Tables - Example:  Digital Marketing Campaign Analysis
  • Find Optimal Campaign Budget Allocation with Excel Add-In Solver - This will change the way you allocate your marketing budgets.
Course requirements or prerequisites?
  • You should be familiar with the basics of Excel.
Who this course is for:
  • Anybody who wants to learn about some key features in Excel how to apply them to common data issues.
  • Marketing Analysts
  • Digital & Web Analysts
  • SEO analysts

Get this course on Udemy

or signup for Optizent Institute and get this course and several others with One Month Free Trial (Cancel anytime)

Tuesday, October 08, 2019

Search Engine Optimization with Google Analytics

There are several tools in the market for Search Engine Optimization (SEO). Some are free and some are paid. Google Analytics is one such tool, which is free.

I have developed an online course, that will teach how to use Google Analytics to get better at Search Engine Optimization (SEO).

Google Analytics provide lots of valuable information that you can use to your advantage and have higher ranking sites on Google, Bing etc.
This course also gives you an overview of Google Webmaster Tools also called Search Console and show you how you can get that data into Google Analytics.

What will you learn:
  1. Understand which Google Analytics reports to use to get insights to improve SEO
  2. Get insight into (not provided) keywords that show up in Google Analytics keyword report.
  3. Get a quick overview of Google Web Master Tools (Google Search Console) and connect it to Google Analytics
  4. Understand and use Landing Pages, Devices, Countries and Keyword reports from Google Search Console
  5. Learn how to compare various traffic drivers showing up in Google Analytics reports.
  6. Segment Organic traffic in your reports.
  7. Get a free SEO Custom Dashboard template that you can use to develop your own dashboard and use it right away and wow your boss.

or get access to all of Optizent courses (50% off First month) at https://training.optizent.com/p/full-access-to-all-courses/?product_id=1025897&coupon_code=FREETRIAL


Thursday, March 14, 2019

Context is Critical: Creating a Culture of Web Analytics

Continuing my series on Creating a Culture of Analytics I would like to touch on a very critical aspect of creating a culture of Web Analytics and that is Context.

What is Context

According to Princeton.edu context is
  • Discourse that surrounds a language unit and helps to determine its interpretation
  • the set of facts or circumstances that surround a situation or event

Context takes the ambiguity out of the equation. As an Analyst it is very important that you provide full context when reporting your web analytics data. Context gets everybody on the same page. Do not leave anything for interpretation by the end users of your reports, give them the insights in a simple and easy to understand format.

Let’s look at an example to understand critical context is.

60 Degrees

If I say it is going to be 60 degrees tomorrow. What will be you reaction?
If you are in Minnesota – You will yell “Summer”
If you are in Seattle, you will think – ““Spring”
If you are in Florida, you will say “ Damn… Cold”
If you are in India, you will say “WTF….” (Indians measures temperature in Celsius and 60 degrees Celsius is 140 F)

Some other question that might pop in people’s mind are:
  • What is the temperature today?
  • Is it normal to have 60 degrees this time of the year

Without context 60 degrees does not mean much. Right.
Similarly when you report your numbers and tell report on visits, page views, time on site etc. it does not mean much unless you provide the full context.

Web Analytics & Context

Just saying that Visits are down by 10% from last week is not enough. You have to put that 10% decline in full context. Tell your end users what happened and why they should or should not worry.

So add something like : Visits are down 10% from last week and also 10% lower compared to the same time last year. Prior to this week we saw a 10% year over year growth but last week was abnormally down. Isn’t that getting better now?

You should go even further: Last year we got some free advertising from local newspaper sites that drove 20% additional traffic same time last year. Since we did not have the advertising deal this year, it impacted our visits this year. We noted the potential impact of newspaper site advertising in our last year’s annual recap (here is the link to last year report – people forget so remind them). If we take out the impact of spike from newspaper sites then we have a consistent pattern of 10% year over year increase. As noted in last few reports, that increase is due to our social media efforts this year. Now the picture is much clearer. Of course you should look into the full impact e.g. conversion, bounces, sales etc. (Note: How you present this story will depend on what format you chose to present your report)

Now everybody is on the same page and knows exactly what those numbers mean. Without that context, everybody would have had their own interpretations of the data. Misinterpretations lead to wrong action and/or mistrust in the data and the analytics team.

Final Words

Do not provide any reports without providing full context. Keep in mind that most of the canned and automatic reports do more harm than good because they do not provide context.

Other posts in the series


Note: This post was originally posted on March 4th, 2011 but it is still very relevant.

Follow me on twitter @anilbatra

Facebook Page http://www.facebook.com/pages/Anil-Batra-Page/130050670343547

Optizent.com - Digital Marketing & Analytics Consulting and Training


Tuesday, September 18, 2018

Advanced Digital Analytics workshop at DA Hub on Oct 17th


I will be conducting a full day advanced digital analytics class at DA Hub in Austin on Oct 17th.

Do you have experience with influencing business change? Are you ready to move into reflective analysis that drives real return on investment for your company? Want to advance your career prospects? This course will help you deliver all of that.

This interactive full day advanced digital analytics course will give you practical tools to elevate your analytics skills. It will also help you transition into a thought leader within your organization. 

Building upon the Fundamentals of Digital Analytics, this course encourages participants to critically examine methods and metrics in ways appropriate for their specific business model.

Learn how to effectively communicate analytical data, best practices for site and campaign design, and examine campaign performance standards from the CFO perspective using control groups and simple predictive models.

Upon completion of this course, participants will be able to:

  • Define gaps between measurement practices and business goals for the company 
  • Create a framework for standardizing the evaluation of current performance measurements for website, search, display, email, affiliate and social channels.
  • Understand how to effectively measure campaigns
  • Understand how to find right opportunities for improvement and optimize them
  • Provide feedback on the design, execution, and outcomes of testing efforts 
  • Manage a results-oriented analytical culture adept at driving business change 


The course follows the Digital Analytics Association's syllabus and is endorsed by it. Participants will be awarded six Professional Development Units (PDU) towards their DAA Certified Web Analyst certification renewal credit.


This works shop will be held in Austin, TX on Oct 17th along with DA Hub. Register at https://www.digitalanalyticshub.com/us_2018/anil_batra?reg_type_id=19719

About DA Hub

DA Hub is bringing together top analytics professionals for in-depth idea exchange. Leading digital analytics and optimization practitioners come from across the US to discuss and share the latest developments, challenges and opportunities in the industry. It is a unique opportunity to be part of the conversation. With over 50 huddles to pick from, run by the industry’s foremost practitioners and only 160 places available, you should book your place for this year’s event to meet, learn, share and network.  Get details at https://www.digitalanalyticshub.com/us_2018/home?reg_type_id=19719


Saturday, August 18, 2018

23 Email Marketing Metrics That You Should Know

A while ago I wrote a post on Measuring Online Display Advertising. Continuing the theme, in this post I am describing 23 metrics for measuring email marketing.

Get this article as an eBook at Global Analytics Academy.
  1. Sent: The numbers of emails (generally unique email address) that were sent. This number excludes any suppressions that occurs due to business rules, privacy compliance etc. Your email service provider (ESP) will have these number as a standard metrics in their reports. This is a raw metrics that is used to calculate other email performance metrics and is generally of low value by itself so should not be used as a Key Performance Indicator (KPI). A trending of this metric overtime can provide you a view into the health of your marketing list.
  2. Delivered is a count of emails that made their way into the recipient inbox. If an email was rejected by the recipients email provide then it is not counted as delivered. If an email shows up in junk folder, it is still counted as delivered. Your email service provider will have these number as a standard metrics in their reports. This is a raw metrics that is used to calculate other metrics. A trending of this metric overtime can provide you a view into the health of your marketing list. Delivery rate (described below) is a better indicator of Delivery issues than the raw number. This metrics by itself is not a KPI but forms a basis for other KPIs.
  3. Delivery Rate – It is calculated as Emails Delivered divided by Emails sent, expressed as a percentage is Email Delivery Rate. Delivery Rate measure the quality of your email list, goal is to have 100% delivery rate, but I can guarantee that it is not going to happen. Any deviation from 100% should be investigated to see what is causing the issues. If there are some hard bounces (see below) then those should be removed promptly. Too many hard bounces can lead to spam triggers and further delivery issues.
  4. Bounce – An email is considered a bounce when it cannot be delivered to the intended email address. There are two types of bounces – Hard Bounce and Soft Bounce. Hard bounce generally means that the email address is wrong or no longer exists. Soft Bounce generally means that the addresses exists but either the inbox is full or is having temporary issues, the message is too large to deliver etc. You should immediately remove Hard Bounces from your email list since they are dead and you will never be able to deliver an email to them. Raw number of bounces should not be used as a KPI.
  5. Bounce Rate – Bounce rate is measured as Bounces divided by emails sent, expressed as a percentage. It is exact opposite of Delivery Rate. (Note: this should not be confused with the Landing Page Bounce Rate)
  6. Total Opens: Total opens measure the number of times your email has been viewed by the recipients. It gets counted when a recipient opens the email. Emails use a small invisible pixel (image) that gets loaded every time an email is viewed, the loading of this invisible pixel is counted as an open. Few things to keep in mind
    1. Any recipient who have disabled the images will not be counted in the open metrics since the invisible pixel won’t be loaded.
    2. Any recipient who has preview pane open will be counted as open as the emails gets loaded in preview pane enough though the person might not actually open it.
    3. Multiple views by same respondent will increase the open count, one for each view (open).
  7. Unique Opens - This measures the number of unique recipients who opened the email. Unlike Total opens, multiple views (opens) by a same recipient will be counted as one unique open.
  8. Total Open Rate – This measure the effectiveness of your subject line and your brand (shown in from column of email) in driving people to open the emails. Email open is the first action by user in their journey to engage with your email. This metrics is calculated as Total Opens divided by Delivered, expressed as percentage.
  9. Total Clicks or Clicks - Total number of clicks on any link in the email is counted in this metric. Keep in mind that a click does not mean that a person landed on the intended destination of the link hence you will likely see a discrepancy in this metric, as shown by your ESP, and the number shown in your Web Analytics tool. There are multiple factors that could lead to a click but not a visit to the destination. If one recipients clicks on multiple links then each click is counted in this metric.
  10. Unique Clicks – Unique Click counts the number of unique recipients who clicked on one or more clicks. Unlike Total Clicks, Unique clicks counts each person only once, no matter how many links that person clicks.
  11. Click to Open Rate – It measures how effective your newsletter content is in driving people to take actions. It is calculated as Unique Clicks divided by Unique Opens, expressed as a percentage.
  12. Total Click Through Rate – It is calculated as Clicks divided by Delivered, expressed as a percentage. If a person clicks on 2 links then the number of clicks will be 2. Considering that one person (email recipient) can click multiple links in the email, this number can potentially go over 100%.
  13. Unique Click Through Rate – It is calculated as Unique Clicks divided by Delivered, expressed as a percentage. Even if one person clicks on multiple links, only one click is counted in this calculation. Keep in mind that if someone talks about Click through Rate then they are referring to this metrics. This is also used for industry benchmarking by various vendors.
  14. Email Conversions – Email Conversion is defined as the count of action that you want the visitors to take when they arrive as a direct result of a click on the email. Some examples of conversions are – purchase, download a whitepaper, sign up for an event etc.
  15. Conversion Rate – It is calculated as Number of Email Conversions divided by Delivered, expressed as a percentage. Some vendors use the sent metrics as denominators and in some organizations I have seen the Unique clicks (visits in the Web Analytics tools) used as the denominators. (also see, 21 Metrics to Measure Online Display Advertising)
  16. Unsubscribes – Number of emails recipients who chose to unsubscribe from your future mailings. This number is available in your ESPs report.
  17. Unsubscribe Rate – Unsubscribes Rate is calculated as Unsubscribes divided by Delivered and is expressed as a percentage. It measure the effectiveness of your email marketing strategy and the quality/relevance of your email marketing. If this number continues to rise, you have a problem that should be immediately fixed. The fixes range from adjusting the email frequency to increasing the relevance of the message.
  18. Email Complaint or Spam Complaint – Number of email subscribers who have marked your emails as Spam. This number is readily available in most of the ESP. SPAM complains can totally kill your email marketing so this number should be watched closely and steps should be taken to ensure that you have users permission to market and are sending the relevant messages at the right frequency. This number should be available from your ESP
  19. Email Complaint Rate/Spam Complaint Rate Number of emails complaints divided by total emails delivered, express as a percentage.
  20. List Growth Rate – Measures, how fast your email list is growing, it is the net results of new subscribers minus the unsubscribes and email/spam complaints. You have to make sure that your list continues to grow rather go in negative direction. Growth (new subscribers – unsubscribes- email complaints) divided by total list size is your growth rate. Your email marketing program depends on List Growth so watch this number closely and take actions to actively grow your email list.
  21. Forward Rate/Share RateThis measures the emails forwarded (shared) by your recipients to their friends/contacts. It is calculated as number of forwards divided by number of emails delivered and is expressed as a percentage. It provides a view into the effectiveness of your email in not only engaging your recipients but also driving new subscribers, people who become of your brand as a results of receiving emails from their friends. This number is available in some ESPs.
  22. RevenueThis measures the Revenue generated as a direct results of email. Several version of Revenue as a KPI are
    1. Revenue Per Sent – Revenue attributed directly to the email divided by number of emails sent. This is also sometimes expressed in terms of Revenue Per 1000 (RPM).
    2. Revenue Per Click - Revenue attributed directly to the email divided by number of unique clicks.
    3. Revenue Per Open ­ - Revenue attributed directly to the email divided by number of unique opens.Revenue numbers won’t be available in your ESP but can be tracked in Web Analytics tools for online sales.
  23. CPM – CPM stand for Cost Per Mile (1000 in Latin). This is generally used when you rent/buy emails list from third parties. It is the cost of renting 1000 email address and is calculated as (Cost/Emails)*1000. This rate should be provided to you by the vendor from whom you are renting the list. If not provided then you can use the above calculations.
Get this article as an eBook at Global Analytics Academy.

Here are few more email marketing posts that you will like:
  1. One costly email mistake that you can easily fix Growing email list is a hard job. All you Growth hacking goes down the drain when you make a simple mistakes that costs you subscribers that you just gained. This posts you one such mistake and how to fix it.
  2. Email Personalization Not Working? Read This This posts explains why the email personalization might not work. The bottom line is that you have update your personalization criteria over time and test it.
  3. 3 Techniques for Expanding your Email Reach Email marketers are facing a tough time with growing emails remaining unopened and unsubscribes. Acquiring new subscribers using old techniques is expensive. In this post I have listed 3 techniques that you can use to spread the word of your emails/newsletters beyond the email list that you are sending the emails to.
  4. Are You Depleting Your Email List? Email marketers, in order to maximize short term conversions, often bombard irrelevant emails in subscribers inbox However this short term mentality results in erosion of long term viability of their email marketing, due to increase in unsubscribes causing depletion of email lists.
  5. 15 Things to Test in your Email Campaign This post talks about 15 things you can test today.
  6. Targeting Cart Abandonment by Email Targeting Cart Abandonment is a great way to drive conversions however, use incentives/offers cautiously.
  7. Conversion Tip: Making the Most of the Email Confirmation Thank you Page Use your Confirmation page effectively, this posts shows an example of a good page and a not so good page.
  8. Number One Email Marketing Mistake Number one mistake marketers make with email marketing is to send “Irrelevant” messages to their customers. Find out why this strategy has a far-reaching impact on your email marketing program.
  9. 7 Ways to Create Relevancy in Emails 7 tried and tested ways of creating relevancy in emails are described in this post.
  10. Relevancy Matters in Email Marketing This post shows an example of an email that missed the opportunity to convert.
Get this article as an eBook at Global Analytics Academy.


Questions/Comments?

Subscribe to my mailing list

* indicates required